Network Traffic Capture
Network Traffic Capture is a functionality that gives you the ability to record network traffic for HTTP/HTTPS requests during Android and iOS/iPadOS mobile app tests on real devices. This provides granular insight into your app’s behavior, facilitates debugging, and helps you determine which development team is responsible for application failure.
With this feature, traffic is recorded on our side and exposes the HAR file through your test’s endpoint, producing HTTP traffic information to help you troubleshoot.
What You'll Need
- A Sauce Labs account (Log in or sign up for a free trial license)
- A native Android, iOS, or iPadOS mobile app that makes HTTP/HTTPS requests. We currently support the following:
- Android 6.0 and higher
- For Swift: iOS 11.0 and higher
- For Objective-C: iOS (all)
Using Network Traffic Capture
To enable network traffic capturing in your tests:
-
On Sauce Labs, click Live > Mobile App.
-
Upload your mobile app to Sauce Labs through our UI or our REST API.
-
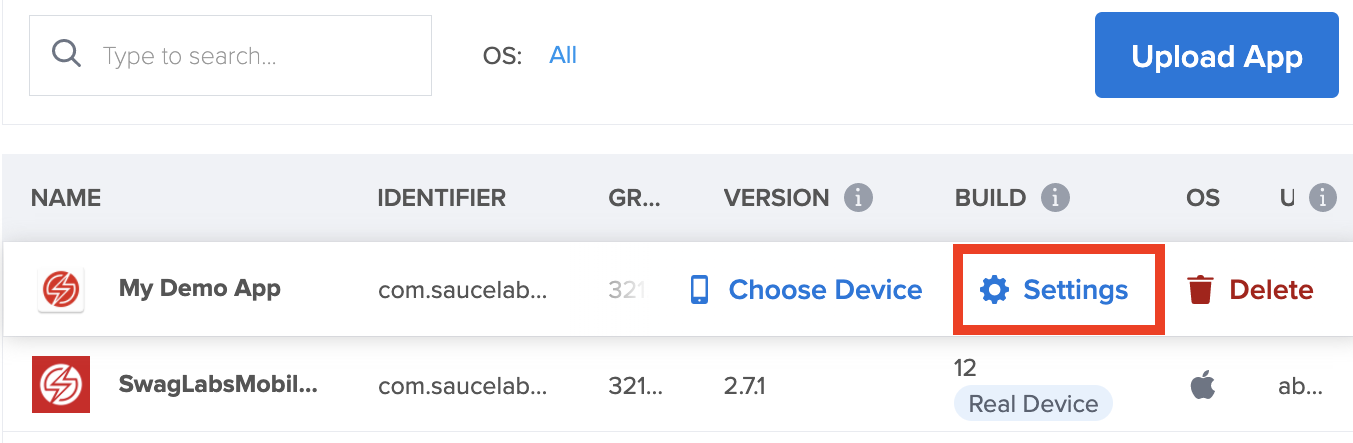
After you’ve uploaded your app, return to the Live > Mobile App page, hover your mouse over your app, then select Settings.
-
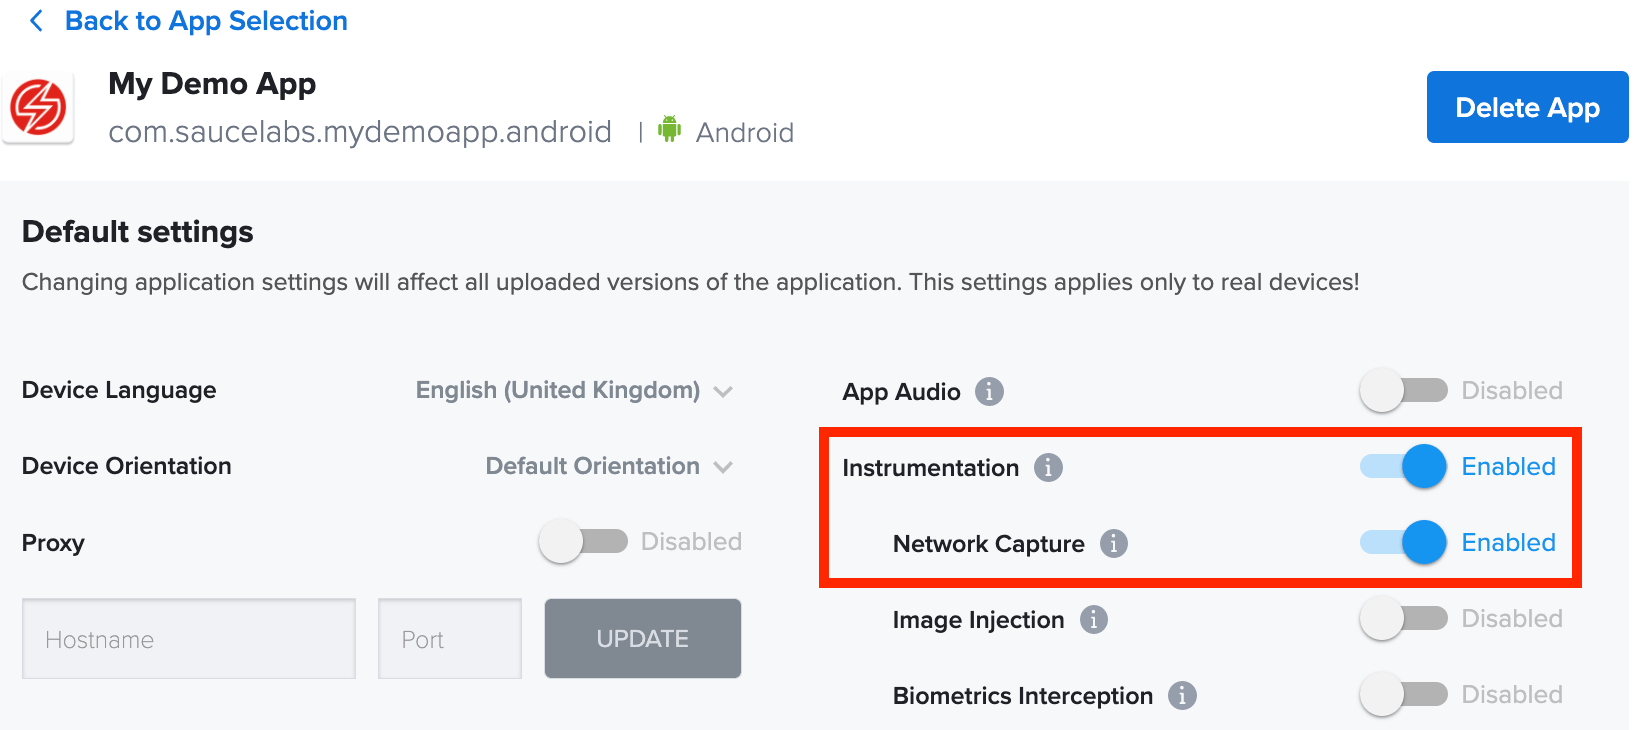
Under Default Settings, toggle Instrumentation and Network Capture to enable the feature.
-
For Automated Testing only: add the networkCapture capability to your test script. Click the link below corresponding to your framework:
Now you can start your live or automated testing session. Your network logs will be captured and displayed in the test results page as well as During a Live Testing session with the Developer Options window.
Accessing Network Traffic in Realtime (Live Testing)
To be able to observe network traffic in realtime:
- Navigate to Live -> Mobile App/Cross Browser
- Choose device and start a session
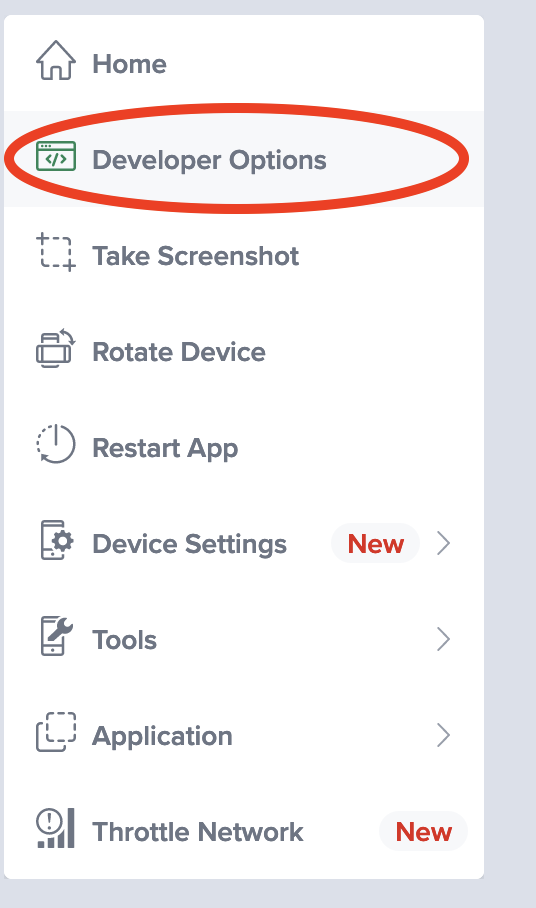
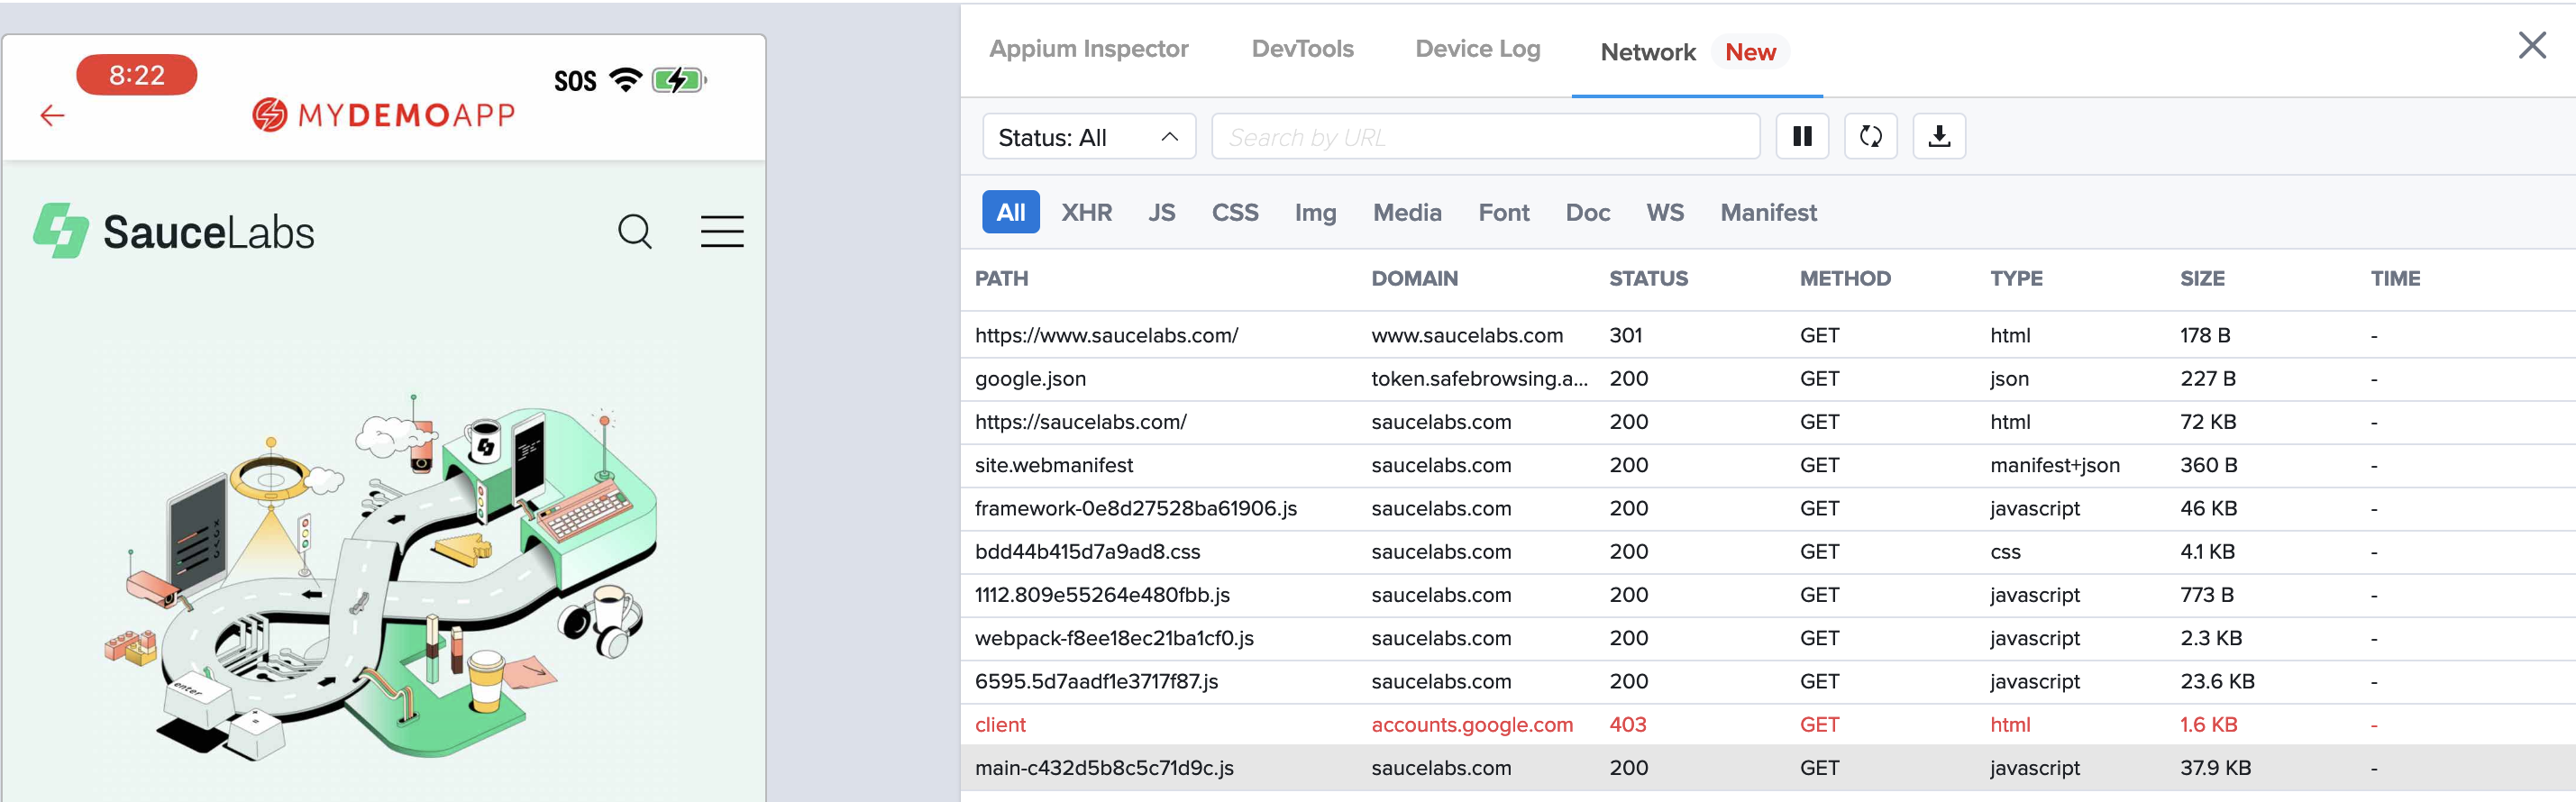
- Launch the network inspector
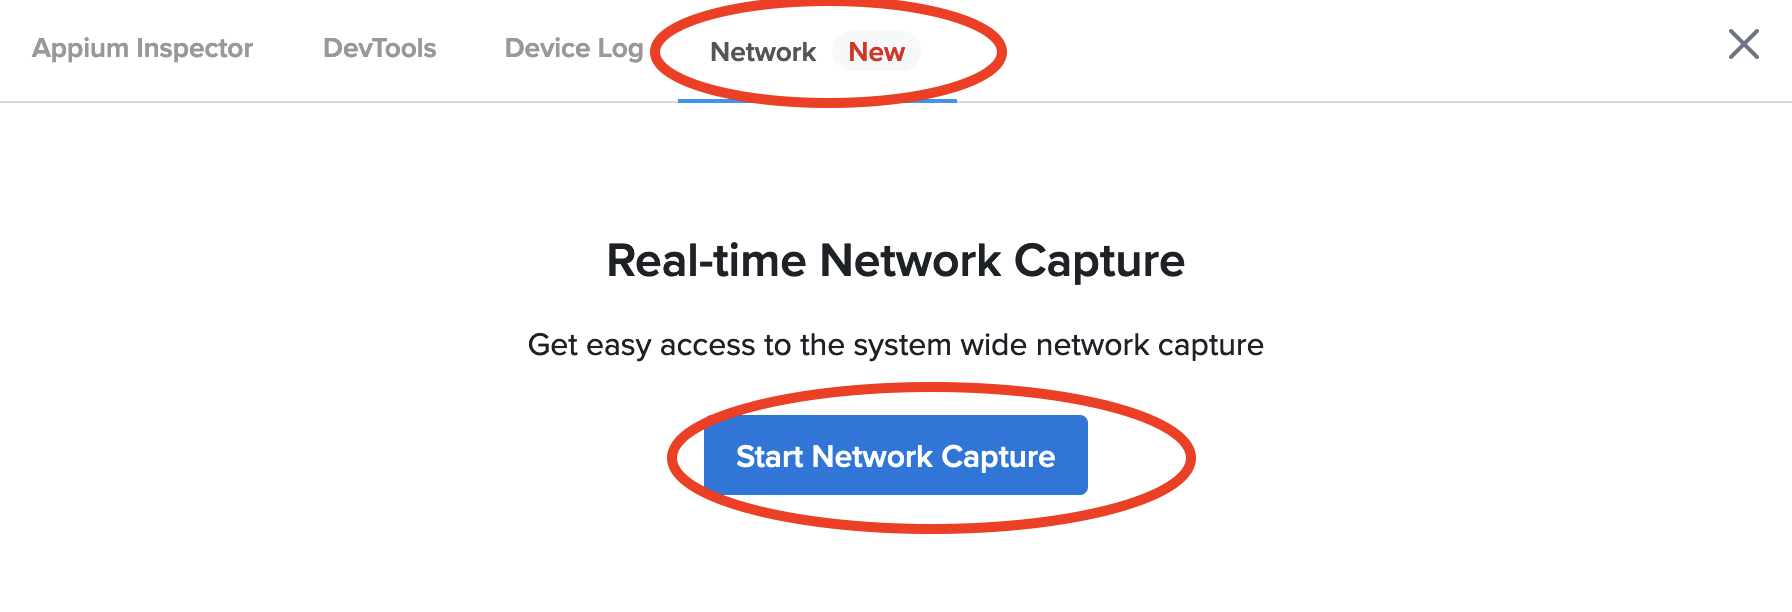
- Start the capture.
- Inspect network logs as they arrive
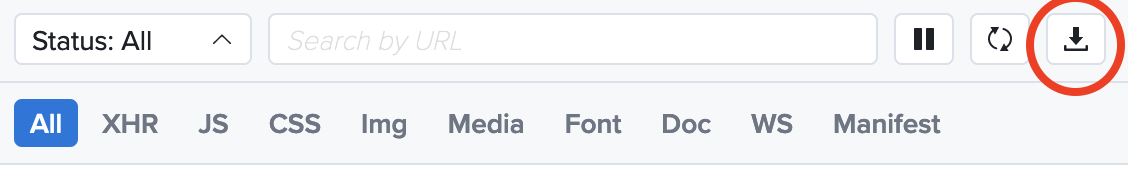
- A copy of what you see in the inspector can be downloaded in HAR format with the following button.
Accessing HAR Files (Live and Automated Testing)
To download HAR files from Sauce Labs:
- Navigate to Test Results.
- Select the applicable test.
- Click the Network tab in the bottom to preview network calls.
- Click the Logs tab on the right panel and select network.har from the dropdown menu to download the report.
You can also download a HAR file programmatically using the following API request:
curl --compressed \
-O https://{SAUCE_USERNAME}:{SAUCE_ACCESS_KEY}@{DATA_CENTER}.saucelabs.com/v1/rdc/jobs/{JOB_ID}/network.har
Viewing HAR Files
You'll need a HAR viewer to read HAR files. Sauce Labs provides a React Network Viewer HAR viewer for your convenience. For step-by-step usage instructions, see our Visualize HAR Files with the New React Network Viewer blog article.
Alternatively, some other commonly used HAR viewers include:
- Chrome devtools builtin HAR imports
- Google Admin Toolbox HAR Analyzer
- Software is Hard blog HTTP Archive Viewer
- Firefox network monitoring builtin HAR imports
HAR Files
HTTP Archive Format (HAR) files collect all network requests and responses made and received by the browser during testing. HAR files offer useful debugging information, such as:
- Identifying browser requests that time out
- Pinpointing requests slowing down the loading process
- Locating faulty API calls
Limitations
- Android Emulators
- iOS Simulators
- Hybrid Applications in automated tests (React Native, Cordova, Flutter)
- Android Chrome Browser in automated tests
- iOS Safari Browser in automated tests
Android
Our network capture code depends on the fact that these classes are not obfuscated:
- okhttp3.Interceptor
- okhttp3.OkHttpClient
- okhttp3.Request
- okhttp3.Response
- okhttp3.ResponseBody
- okio.Buffer
- com.android.volley.AuthFailureError
- com.android.volley.NetworkResponse
- com.android.volley.Request
- com.android.volley.RequestQueue
- com.android.volley.Response
iOS
- Network capture works if the app uses NSURLSession or a library (like Alamofire or AFNetworking) that uses NSURLSession inside.
- Calls made by NSURLConnection (deprecated by Apple), will not be captured.