Track Job Runs Over Tim
The Job History page provides a visual overview of test executions over time, helping you monitor job activity and identify execution patterns. The bar chart highlights changes in test outcomes, making it easier to detect anomalies, investigate failures, and evaluate test performance across different platforms, operating systems, and browsers.
The Extended Debugging feature offers access to HAR files and JavaScript console logs, assisting in the identification of flaky tests. For more details, refer to Debugging Tests with JavaScript Console Logs and HAR Files (Extended Debugging).
Access the Job History Page
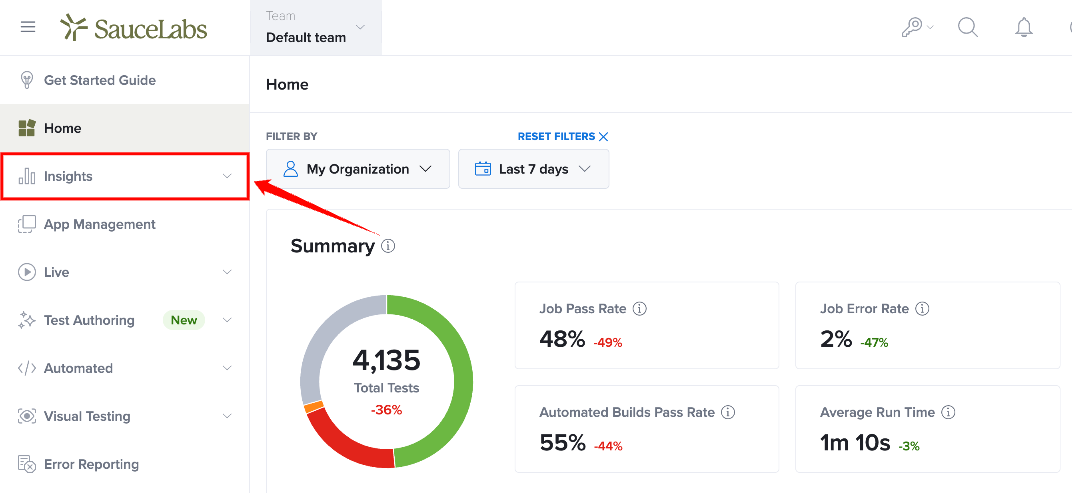
Step 1: Inside your Sauce Labs account, navigate to the left-hand navigation menu and then expand Insights.
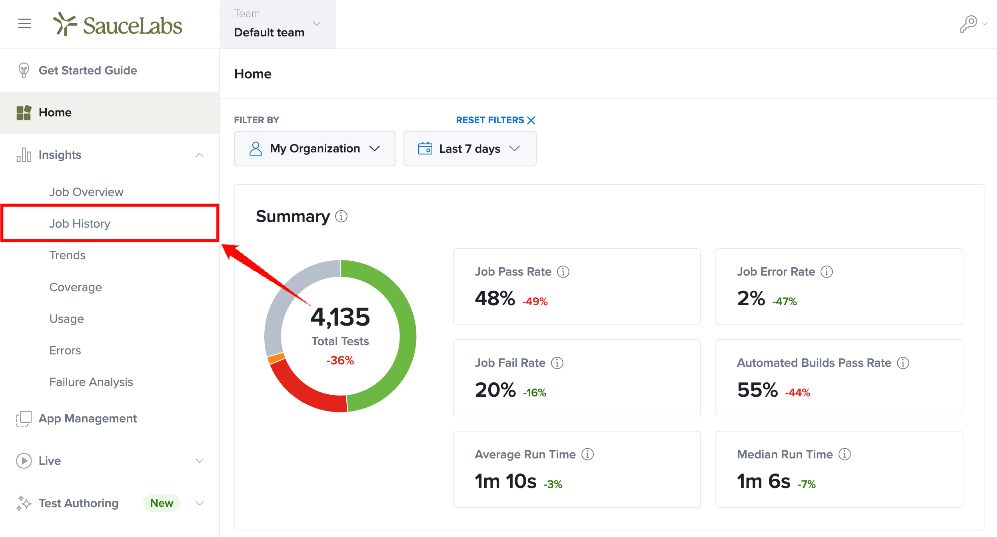
Step 2: Select Job History from the dropdown list.
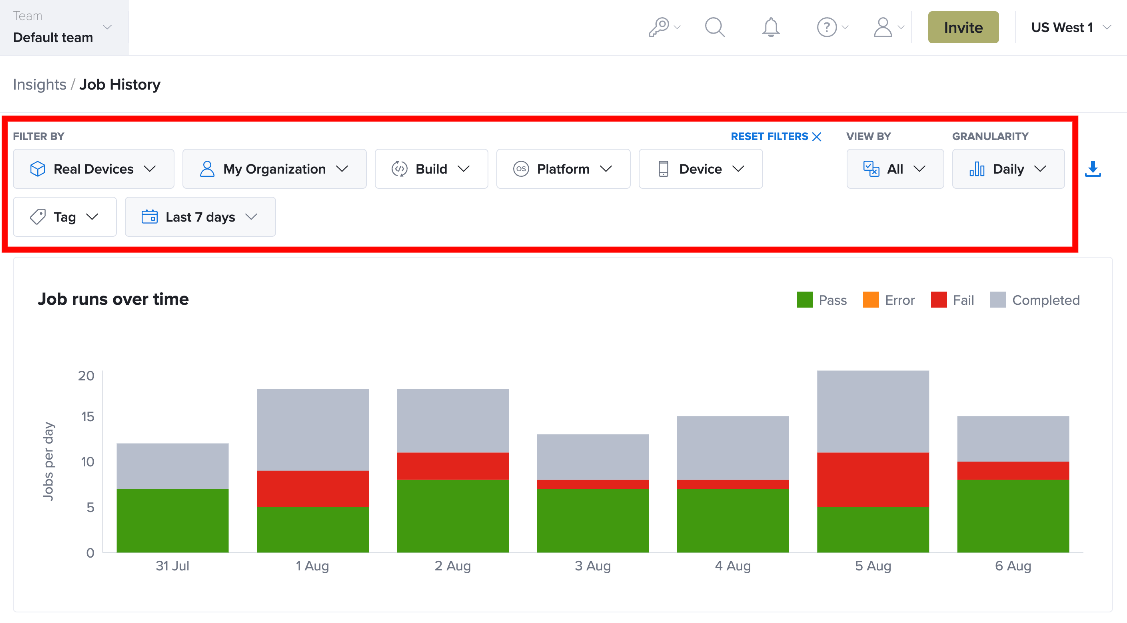
Step 3: Apply filters to narrow the displayed job execution data. For more information, see Filter Controls for Job History.
View Job Runs Over Time
The bar chart at the top of the Job History page displays the number of test executions during the selected reporting period. Depending on the selected date range, the data is grouped into hourly, daily, or weekly intervals.
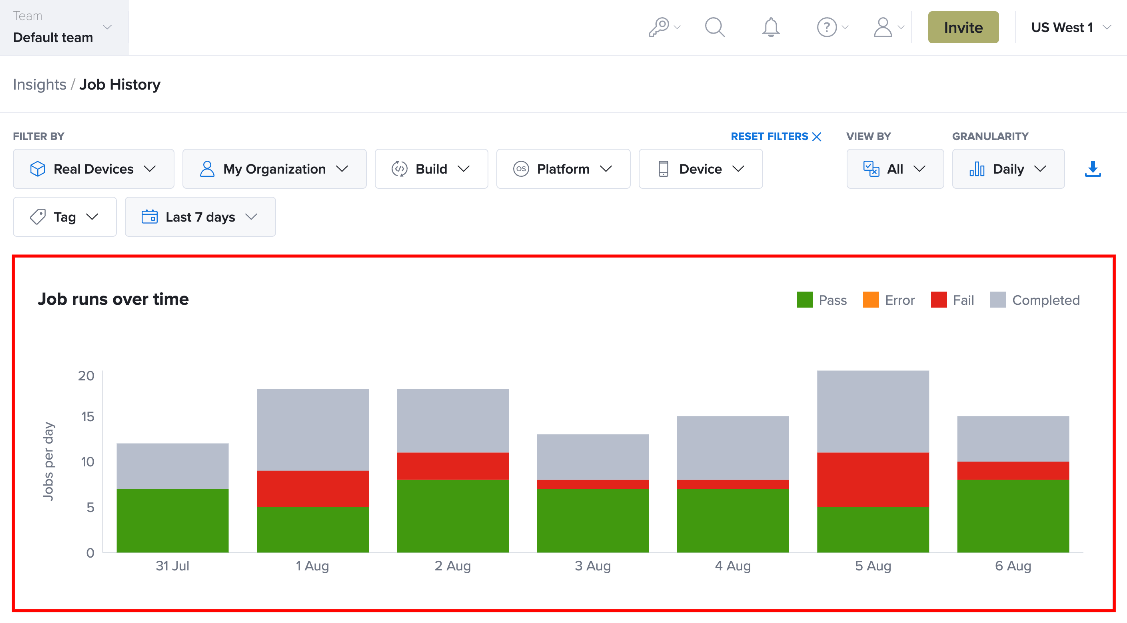
Each bar represents the total number of jobs executed during a specific time interval and includes the following execution statuses:
-
Passed
-
Failed
-
Errored
-
Completed
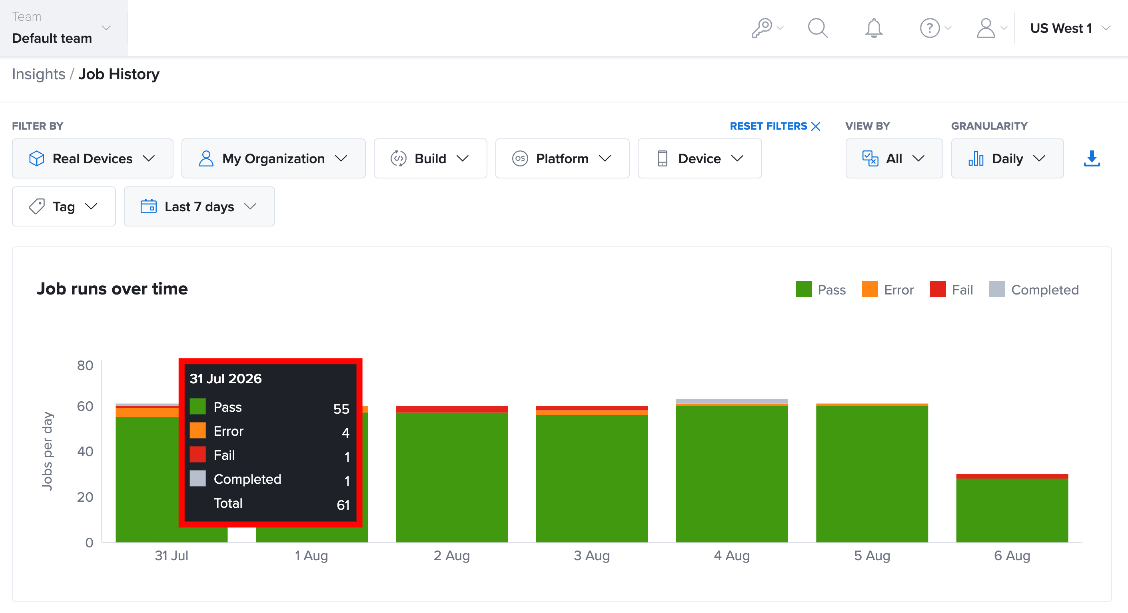
Hover over a bar to view the number of jobs for each execution status during that time interval.
Review Job Execution Statistics
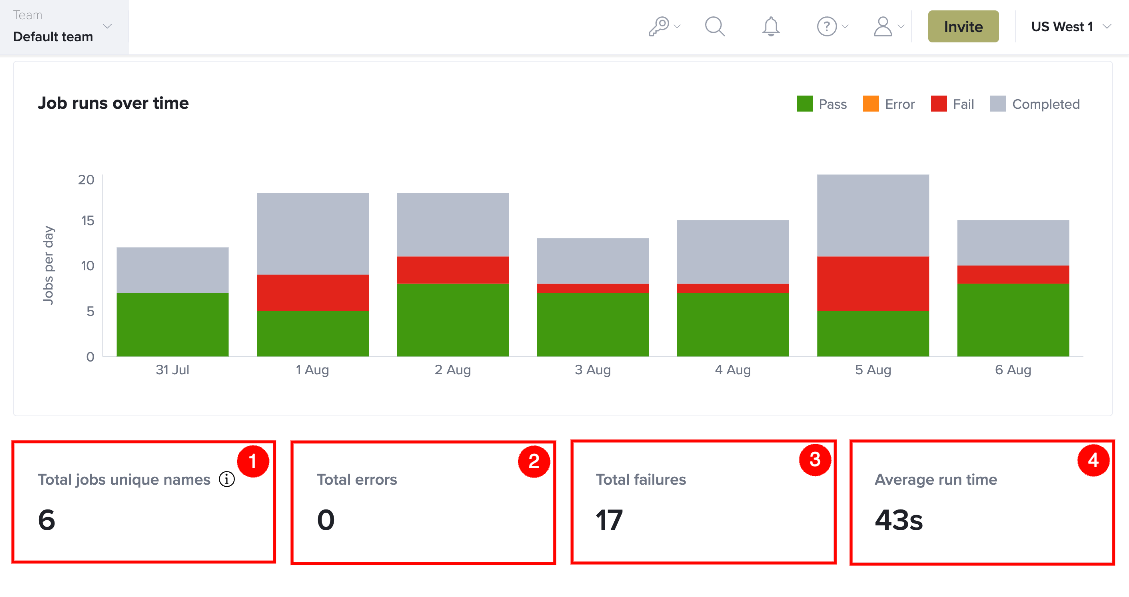
Below the Job Runs Over Time chart, the Job History page displays summary statistics that provide a high-level overview of the selected job execution data.
These metrics help you quickly evaluate the overall health of your test executions by highlighting the number of unique jobs, execution failures, errors, and the average runtime for the selected reporting period.
| Ref. | Statistic | Description |
|---|---|---|
| 1 | Total Job Unique Names | Displays the total number of unique job names included in the selected results. Multiple executions of the same job are counted as a single unique job. |
| 2 | Total Errors | Displays the total number of test executions that ended with an Error status, indicating that the tests did not complete successfully due to an execution or infrastructure issue. |
| 3 | Total Failures | Displays the total number of test executions with a Failed status, indicating that the tests completed but one or more assertions failed. |
| 4 | Average Runtime | Displays the average execution time of all jobs included in the selected results, helping you monitor execution performance over time. |
Export Job Results
You can export the displayed job history data for offline analysis or reporting.
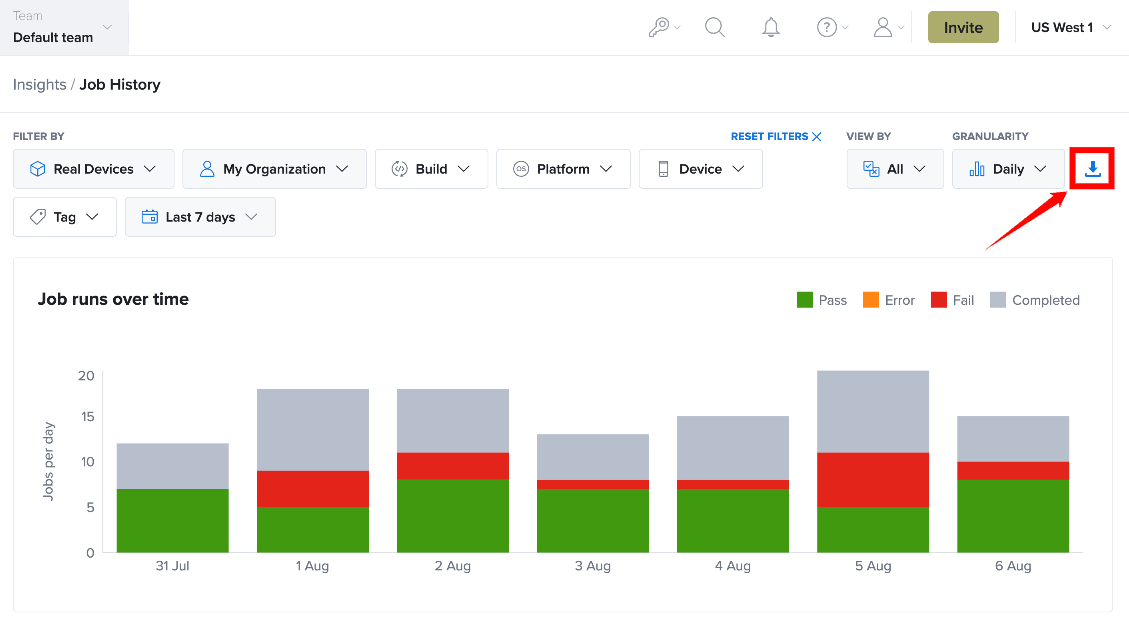
To export the job results, click the Download icon in the upper-right corner of the Job History page. Sauce Labs downloads the displayed job results as a CSV file based on the applied filters.