Job Performance Analysis
The Job Performance Analysis page provides a detailed view of the execution history for an individual test job. It helps you understand how the job has performed over time by displaying execution trends, summary metrics, and a chronological list of all job runs.
This information can help you identify recurring failures, investigate flaky tests, and determine when changes in test behavior occurred.
Step 1: Inside your Sauce Labs account, from the left-hand navigation menu, expand Insights, and then select Job History.
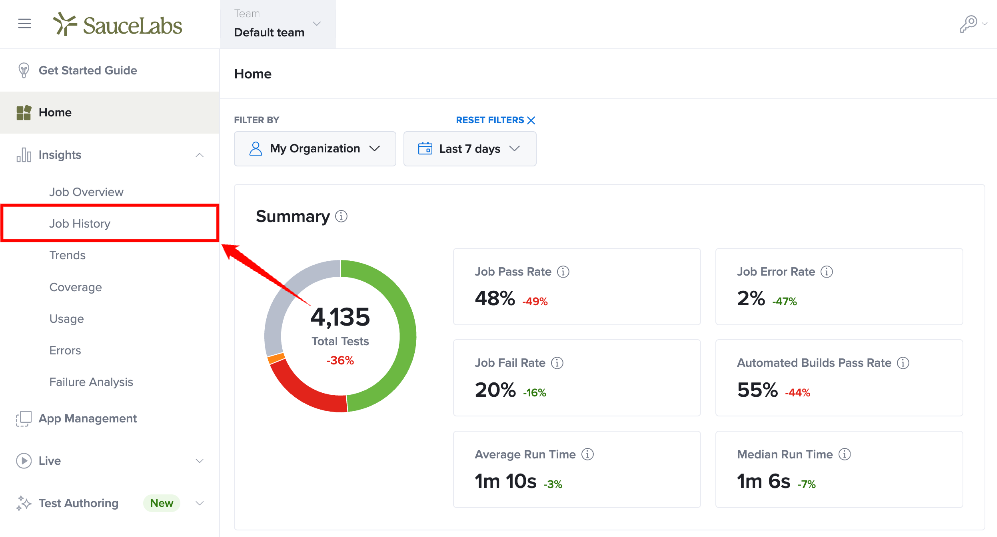
Step 2: Scroll down to the Job History table, locate the job you want to investigate, and then click on its Job Name.
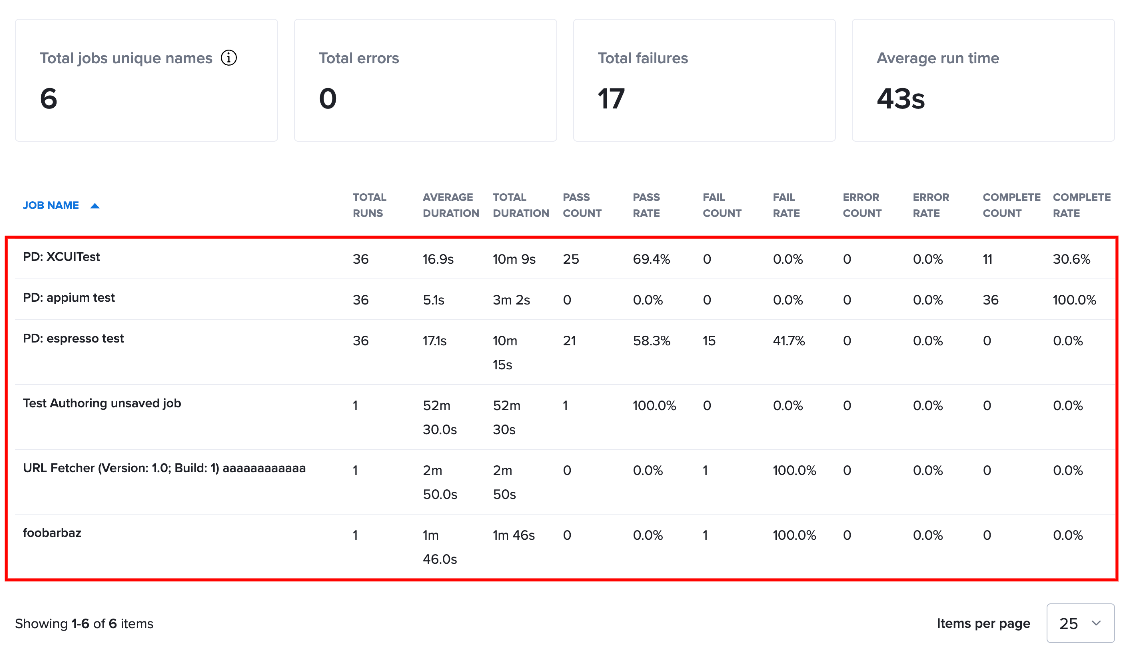
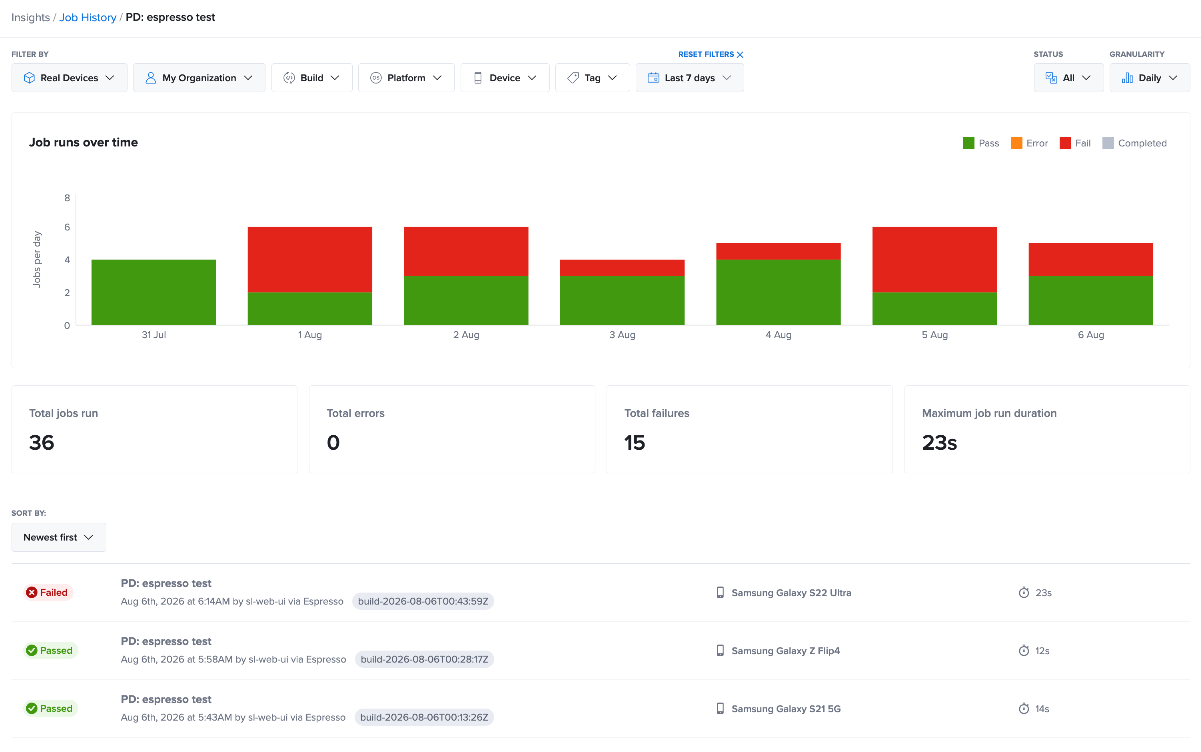
Step 3: The Job Performance Analysis page opens, displaying the execution history, performance metrics, and detailed job runs for the selected job.
Review the Job History Table
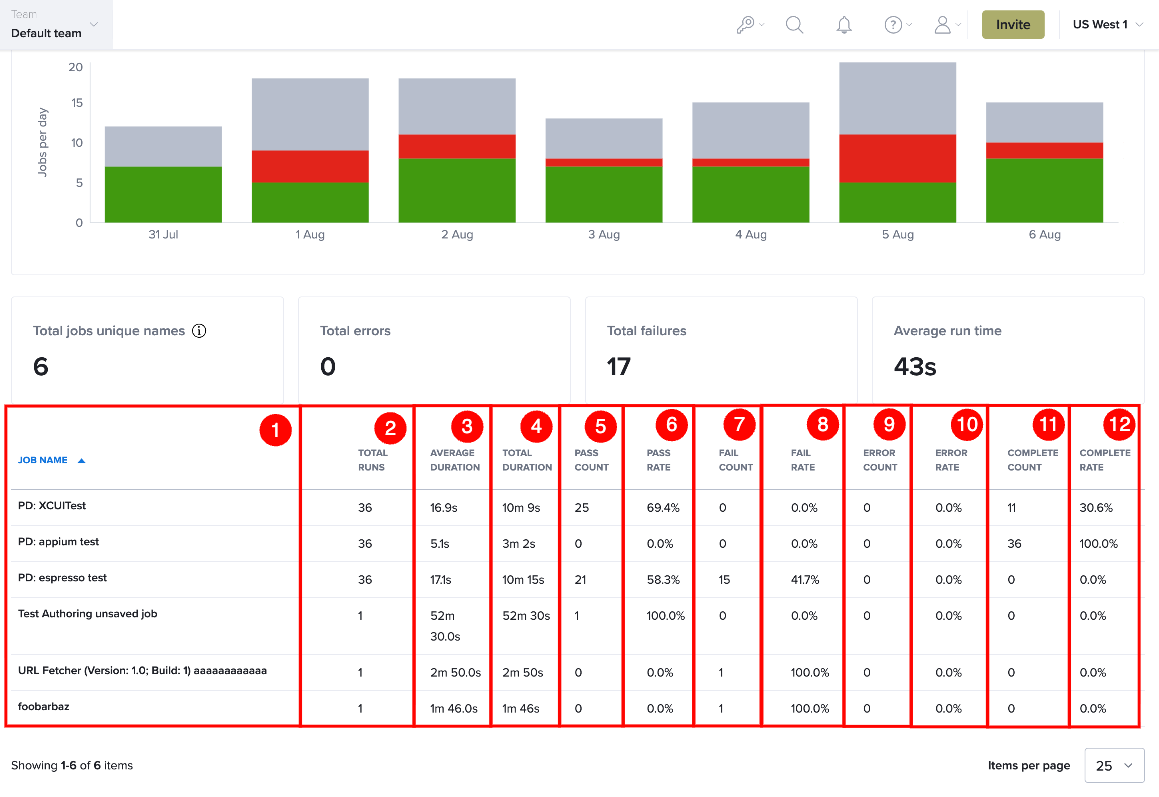
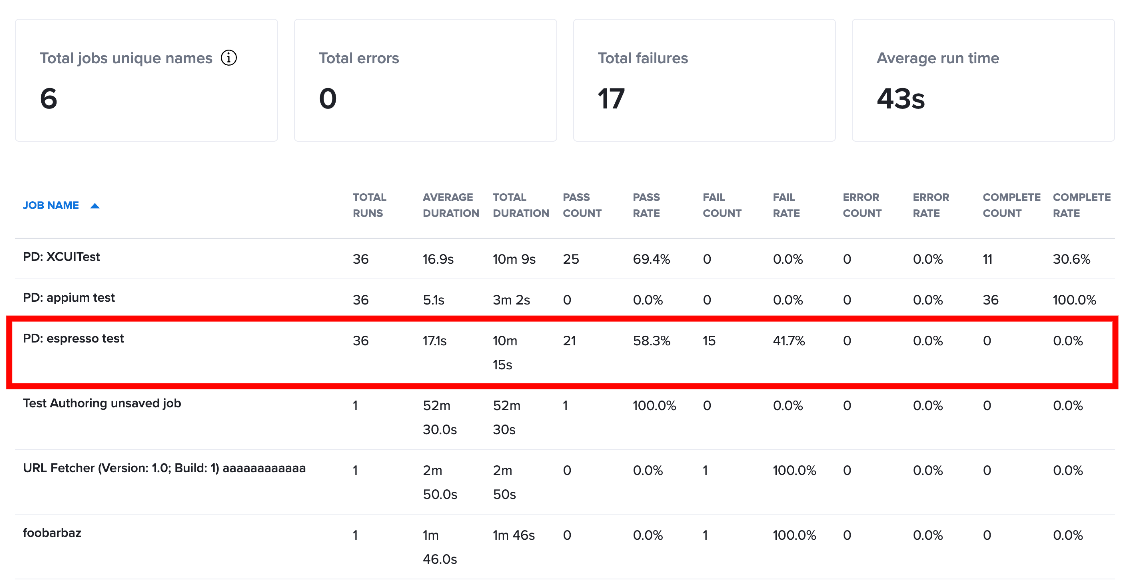
The Job History table summarizes execution statistics for each unique test job during the selected reporting period. Each row represents one test job and aggregates data from all of its executions, allowing you to quickly identify frequently executed jobs, compare success rates, and detect unstable or failing tests.
The following table describes the information available for each job.
| Ref. | Column | Description |
|---|---|---|
| 1 | Job Name | Displays the name of the test job. Select the job name to open the Job Performance Analysis page, where you can review the job's execution history, performance metrics, and individual test runs. |
| 2 | Total Runs | Displays the total number of times the job was executed during the selected reporting period. This helps you understand how frequently the job has been run. |
| 3 | Average Duration | Displays the average amount of time taken to complete the job across all recorded executions. Use this value to compare the typical execution time of the job over time. |
| 4 | Total Duration | Displays the combined execution time of all recorded job runs during the selected reporting period. This helps you understand the total execution time consumed by the job. |
| 5 | Pass Count | Displays the total number of job executions that completed successfully with a Passed status. |
| 6 | Pass Rate | Displays the percentage of successful job executions relative to the total number of runs. A higher pass rate generally indicates a more stable and reliable test. |
| 7 | Fail Count | Displays the total number of job executions that completed with a Failed status. Use this value to identify jobs that are failing frequently. |
| 8 | Fail Rate | Displays the percentage of job executions that failed during the selected reporting period. A high fail rate may indicate issues with the application or the test itself. |
| 9 | Error Count | Displays the total number of job executions that ended because of an execution error, preventing the test from completing successfully. |
| 10 | Error Rate | Displays the percentage of job executions that ended with an error. Monitoring the error rate can help identify infrastructure, environment, or configuration issues affecting test execution. |
| 11 | Complete Count | Displays the total number of job executions that completed without reporting an explicit Passed or Failed status. |
| 12 | Complete Rate | Displays the percentage of job executions that completed without an explicit pass or fail status. A high completion rate may indicate that the test results are not reporting their final status correctly and may require further investigation. |
Example: Investigate an Inconsistent Test
The Job Performance Analysis page can help you identify when a previously stable test begins failing and narrow down the period in which the behavior changed.
In this example, the PD: espresso test completed 36 executions during the selected reporting period, with 21 successful executions (58.3%) and 15 failed executions (41.7%). The difference between the pass and fail rates indicates that the test is producing inconsistent results and may be flaky.
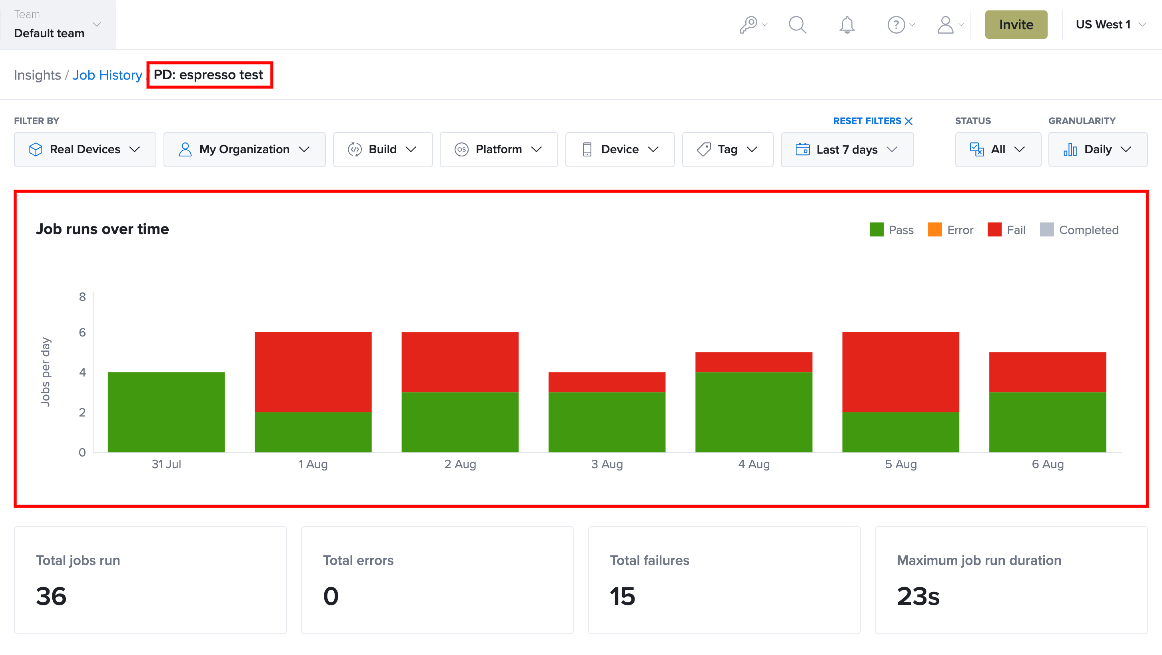
Selecting the Job Name opens the Job Performance Analysis page. The Job runs over time chart shows that the test produced both passed and failed executions during the selected reporting period, with August 5 recording the highest number of failures. The summary statistics also show 36 total job runs, 15 failures, 0 errors, and a maximum job run duration of 23 seconds.
Reviewing the execution history reveals that the test alternated between successful and failed executions. For example, on August 6, 2026, the test failed at 6:14 AM, while earlier executions at 5:58 AM, 5:43 AM, and 5:42 AM completed successfully.
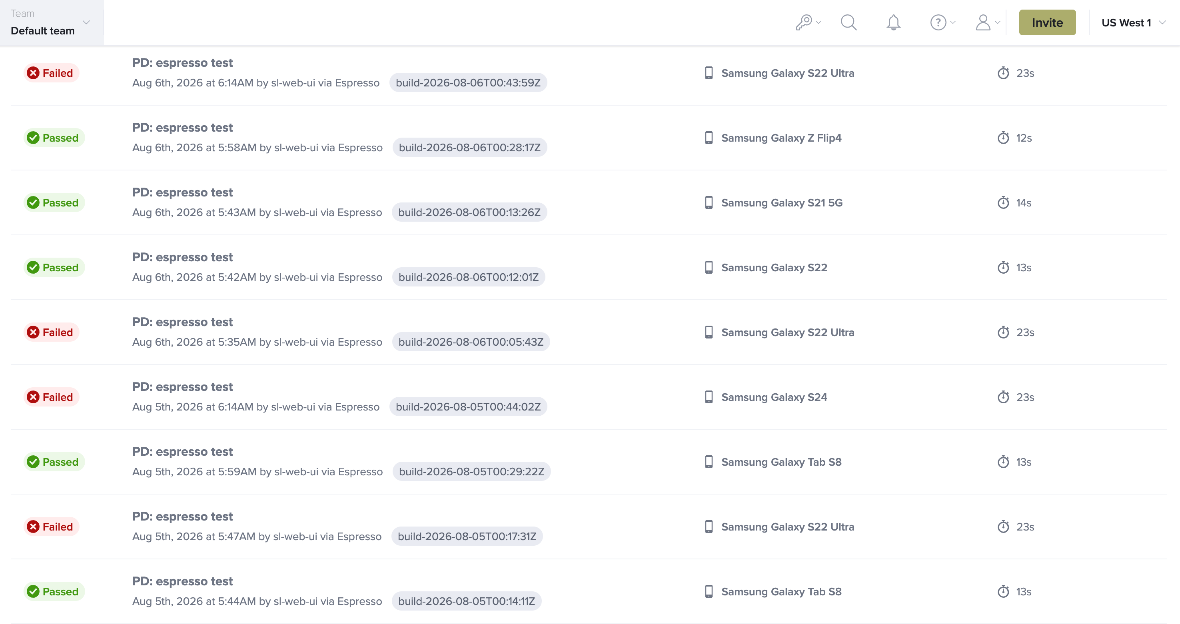
This information helps narrow the investigation to a specific time period, making it easier to review changes made to the application, test code, or execution environment that may have introduced the failures.