Stability Metrics Table
The Stability Metrics table at the bottom of the Releases view provides an overview of the health and stability of each selected release. The table title includes the attribute used for comparison, such as Compare groups by application.version.
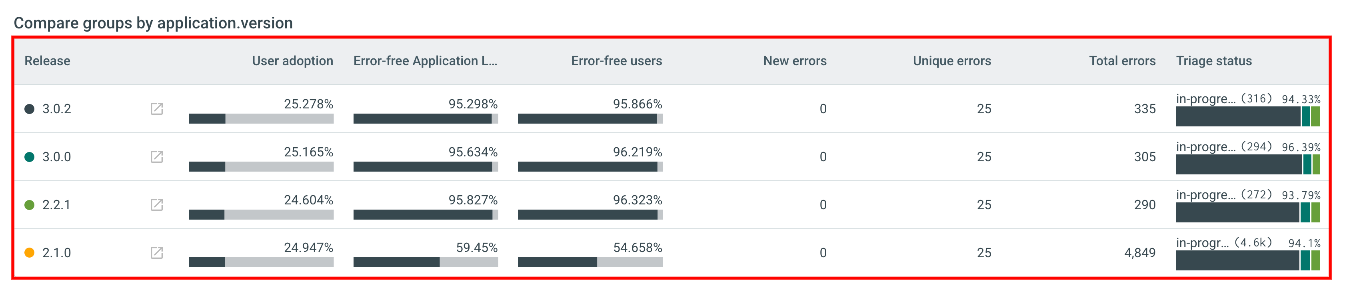
Metrics in the Table
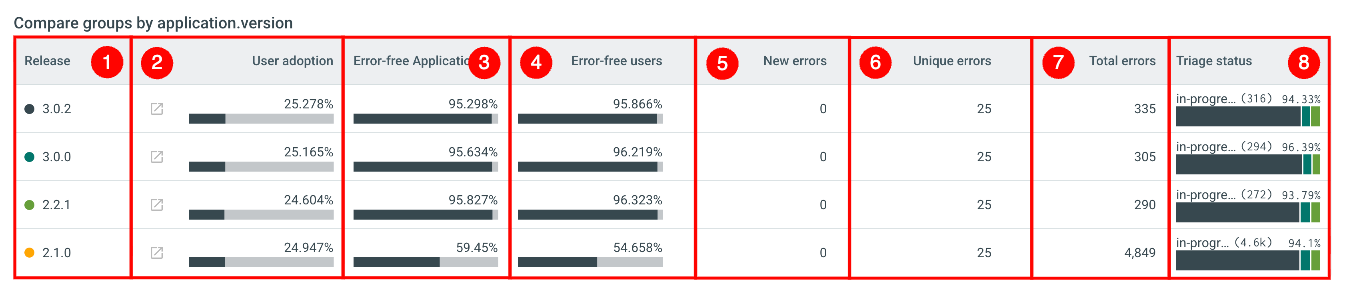
| Ref. | Column | What it shows |
|---|---|---|
| 1 | Release | The release name and color, plus a link icon that opens the release in the Triage view. |
| 2 | User adoption | The release's share of user activity, as a percentage. |
| 3 | Error-free Application Launches | The percentage of application launches (sessions) in which no errors occurred. |
| 4 | Error-free users | The percentage of users who haven't experienced an error. |
| 5 | New errors | The number of errors never seen before this release. |
| 6 | Unique errors | The number of distinct errors reported for the release. |
| 7 | Total errors | The total number of errors reported for the release. |
| 8 | Triage status | A bar showing how the release's errors split across triage states, labeled with the largest state, its error count, and its share. |
Understand Triage Status
The Triage status column shows the distribution of errors across different triage states.
For example, in-progress (316) 94.33% means that 316 of the release's 335 total errors, or 94.33%, are in progress.
Understand Percentage Metrics
Percentage-based metrics include a visual bar below the value. The dark portion represents the reported percentage, while the gray portion represents the remaining percentage up to 100%. This makes it easier to compare values across releases.
View Details for a Percentage Metric
Hover over a percentage metric to view the numbers used to calculate it.
For example, hovering over Error-free Application Launches displays the number of error-free launches and the total number of launches.
Open a Release in Triage
You can open a release directly in the Triage view to investigate its errors.
Step 1: Find the release you want to investigate in the table and click the link icon next to the release name.
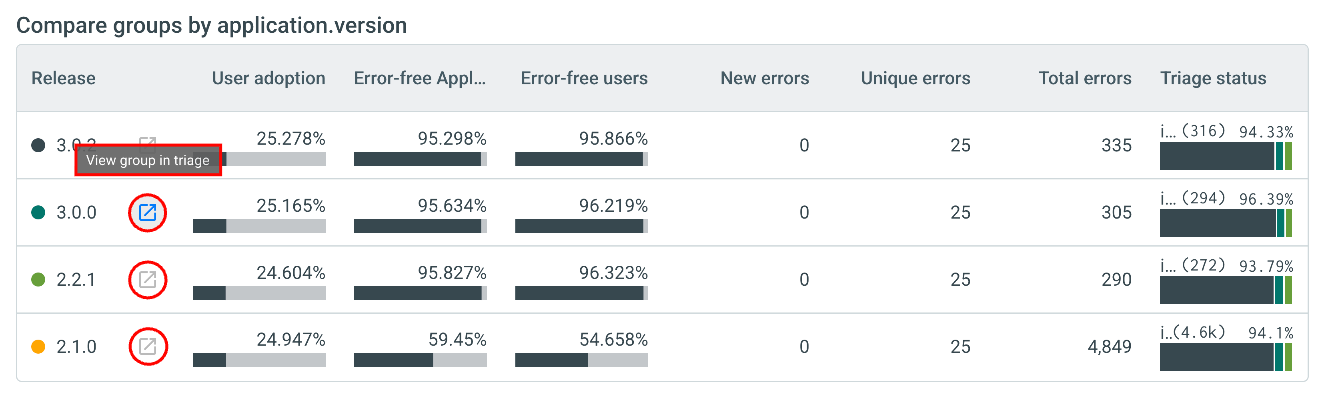
The Triage view opens with the selected release already applied as a filter.
In the Triage view, errors are grouped by fingerprints. Start by reviewing fingerprints that affect the most users or have the highest number of reported errors. For more information, see Triage.